|
|
#案例:某天你的更高级领导问网站并发多少,某个时间段的访问量多少,要是没有个分析日志的工具还真心不行,一般云服务器自带统计工具,但是物理服务器可是要自己弄的。不管你用的是何种web,都可以利用一些工具统计访问信息,那么今天博主用shell AWStats、ELK分析Nginx访问日志。如有不足或者更好意见,欢迎指出。
首先说说访问相关的专业词汇:
IP(独立IP):即Internet Protocol,指独立IP数。00:00-24:00内相同IP地址之被计算一次。
PV(访问量):即Page View, 即页面浏览量或点击量,用户每次刷新即被计算一次。
UV(独立访客);Unique Visitor,访问网站的一台电脑客户端为一个访客。00:00-24:00内 相同的客户端只被计算一次。 VV:Visit View,访问次数,是指统计时段内所有访客的PV总和
CPC:Cost PerClick,每次点击费用,即点击单价。
CPM:Cost Per Mile千次展示费用,即广告展示一千次需要支付的费用。
RPM:Revenue PerMille 千次展示收入,和CPM类似,RPM是针对广告展示商(比如Adsense商户)而言的。
CTR:Click-throughRate,点击率,点击次数占展示次数的百分比。
方式一、用shell统计Nginx日志
1.1)把Nginx日志类型过滤出来:
1
2
3
4
5
| log_format access '$remote_addr - $remote_user[$time_local] "$request" '
'$status $body_bytes_sent"$http_referer" '
'"$http_user_agent" "$http_x_forwarded_for" ';
access_log logs/access.log access;
error_log logs/error.log error;
|
1.2)日志相关参数含义:
日志相关参数官网给的解释是:Module ngx_http_log_module
$remote_addr, $http_x_forwarded_for 记录客户端 IP
$remote_user 记录客户端用户名称
$time_local 通用日志格式下的本地时间
$request 记录请求的 URL 和 HTTP Protocol
$status 记录请求状态
$body_bytes_sent 发送给客户端的 Bytes,不包括 Header 的大小;该变数与 Apache mod_log_config 的 "%B" 相容
$bytes_sent 发送给客户端的 总Bytes数
$connection 连接的序列号
$connection_requests 当前通过一个连接获得的请求数量
$msec 日志写入时间。单位为秒,精度是毫秒
$pipe 如果请求是通过HTTP流水线(pipelined)发送,pipe值为"p",否则为"."
$http_referer 记录从哪个页面链接访问过来的
$http_user_agent 记录客户端浏览器相关信息
$request_length 请求的长度(包括请求行,请求头和请求正文)
$request_time 请求处理时间,单位为秒,精度毫秒; 从读入客户端的第一个位元组开始,直到把最后一个字元发送给客户端后进行日志写入为止
$time_iso8601 ISO8601标准格式下的本地时间
1.3)查看Nginx日志:
1
2
3
4
5
6
7
8
9
10
| [iyunv@nginx logs]# cat access.log
192.168.1.131 - -[29/Jan/2016:04:40:31 +0800] "GET / HTTP/1.1" 200 612"-" "Mozilla/5.0 (Windows NT 6.1; WOW64) AppleWebKit/537.36 (KHTML, like Gecko) Chrome/47.0.2526.80 Safari/537.36 Core/1.47.163.400 QQBrowser/9.3.7175.400" "-"
192.168.1.131 - -[29/Jan/2016:04:40:31 +0800] "GET /favicon.ico HTTP/1.1" 302 160"http://192.168.1.220/" "Mozilla/5.0 (Windows NT 6.1; WOW64) AppleWebKit/537.36 (KHTML, like Gecko) Chrome/47.0.2526.80 Safari/537.36 Core/1.47.163.400 QQBrowser/9.3.7175.400" "-"
192.168.1.131 - -[29/Jan/2016:04:41:20 +0800] "GET / HTTP/1.1" 304 0"-" "Mozilla/5.0 (Windows NT 6.1; WOW64) AppleWebKit/537.36 (KHTML, like Gecko) Chrome/47.0.2526.80 Safari/537.36 Core/1.47.163.400 QQBrowser/9.3.7175.400" "-"
192.168.1.131 - -[29/Jan/2016:04:41:47 +0800] "GET / HTTP/1.1" 304 0"-" "Mozilla/5.0 (Windows NT 6.1; WOW64) AppleWebKit/537.36 (KHTML, like Gecko) Chrome/47.0.2526.80 Safari/537.36 Core/1.47.163.400 QQBrowser/9.3.7175.400" "-"
192.168.1.243 - -[29/Jan/2016:11:49:26 +0800] "GET /favicon.ico HTTP/1.1" 302 160"-" "Mozilla/5.0 (Windows NT 6.3; WOW64) AppleWebKit/537.36 (KHTML, like Gecko) Chrome/45.0.2454.101 Safari/537.36" "-"
192.168.1.243 - -[29/Jan/2016:11:49:28 +0800] "GET / HTTP/1.1" 200 612"-" "Mozilla/5.0 (Windows NT 6.3; WOW64) AppleWebKit/537.36 (KHTML, like Gecko) Chrome/45.0.2454.101 Safari/537.36" "-"
192.168.1.243 - -[29/Jan/2016:11:49:28 +0800] "GET /favicon.ico HTTP/1.1" 302 160"http://192.168.1.220/" "Mozilla/5.0 (Windows NT 6.3; WOW64) AppleWebKit/537.36 (KHTML, like Gecko) Chrome/45.0.2454.101 Safari/537.36" "-"
192.168.1.172 - -[29/Jan/2016:11:56:43 +0800] "GET / HTTP/1.0" 200 612"-" "-" "-"
[iyunv@nginx logs]#
|
1.4)根据需求过滤:
1.4.1)根据访问IP统计UV
1
| awk '{print $1}' access.log|sort | uniq -c |wc -l
|
1.4.2)统计访问URL统计PV
1
| awk '{print $7}' access.log|wc -l
|
1.4.3)查询访问最频繁的URL
1
| awk '{print $7}' access.log|sort | uniq -c |sort -n -k 1 -r|more
|
1.4.4)查询访问最频繁的IP
1
2
| awk '{print $1}' access.log|sort | uniq -c |sort -n -k 1 -r|more
awk '{print $1}' access.log | sort | uniq -c | sort -n -k 1 -r | head -n 5
|
1.4.5)根据时间段统计查看日志
1
| cat access.log| sed -n "/2016:04:40/,/2016:11:00/"p access.log|awk '{print $1,$3,$4}'
|
1.6)效果查看
1
2
3
4
5
6
7
8
9
10
11
12
13
14
15
16
17
18
19
20
21
| [iyunv@nginx logs]# awk '{print $1}' access.log|sort | uniq -c |wc -l
3
[iyunv@nginx logs]# awk '{print $7}' access.log|wc -l
8
[iyunv@nginx logs]# awk '{print $7}' access.log|sort | uniq -c |sort -n -k 1 -r|more
7 HTTP/1.1"
1 HTTP/1.0"
[iyunv@nginx logs]# awk '{print $1}' access.log|sort | uniq -c |sort -n -k 1 -r|more
4 192.168.1.131
3 192.168.1.243
1 192.168.1.172
[iyunv@nginx logs]# cat access.log| sed -n "/2016:04:40/,/2016:11:00/"p access.log|awk '{print $1,$3,$4}'
192.168.1.131 -[29/Jan/2016:04:40:31 +0800]
192.168.1.131 -[29/Jan/2016:04:40:31 +0800]
192.168.1.131 -[29/Jan/2016:04:41:20 +0800]
192.168.1.131 -[29/Jan/2016:04:41:47 +0800]
192.168.1.243 -[29/Jan/2016:11:49:26 +0800]
192.168.1.243 -[29/Jan/2016:11:49:28 +0800]
192.168.1.243 -[29/Jan/2016:11:49:28 +0800]
192.168.1.172 -[29/Jan/2016:11:56:43 +0800]
[iyunv@nginx logs]#
|
1.7.1)压测统计,测试等性能评估
1.7.2)根据访问过滤403,404等代码状态
1.7.3)封ip
1.8)功能评估:
1.8.1)可用于临时需求,但是并不智能,需要会一些sed awk sed等工具知识
1.8.2)没有图形化,看起来不方便
方式二、用AWStats来分析Nginx日志
2.1)nginx日志切割:(`date +%Y%m%d`.log切割形式即可,方便管理,当然也可以自己定义)
1
2
3
4
5
| #!/bin/bash
logs_path="/usr/local/nginx/logs/"
pid_path="/usr/local/logs/nginx.pid"
mv ${logs_path}access.log ${logs_path}access_`date +%Y%m%d`.log.log
kill -USR1 `cat ${pid_path}
|
2.1.1)计划任务
1
| 59 23 * * * /root/nginxcut.sh
|
2.2)awstas7.0后新特性:(目前出到7.5)
访问次数、独特访客人数,
访问时间和上次访问,
使用者认证、最近认证的访问,
每周的高峰时间(页数,点击率,每小时和一周的千字节),
域名/国家的主机访客(页数,点击率,字节,269域名/国家检测, geoip 检测),
主机名单,最近访问和未解析的 IP 地址名单
档案类型,
网站压缩统计表(mod_gzip 或者 mod_deflate),
使用的操作系统 (每个操作系统的页数,点击率 ,字节, 35 OS detected),
使用的浏览器,
机器人访问(检测 319 个机器人),
蠕虫攻击 (5 个蠕虫家族),
搜索引擎,利用关键词检索找到你的地址,
HTTP 协议错误(最近查阅没有找到的页面)
其他基于 URL 的个性报导,链接参数, 涉及综合行销领域目的.
贵网站被加入”最喜爱的书签”.次数.
屏幕大小(需要在索引页补充一些 HTML 标签).
浏览器的支持比例: Java, Flash, RealG2 reader, Quicktime reader, WMA reader, PDF reader.
负载平衡服务器比率集群报告.
2.3)安装配置:
2.3.1)安装
1
2
3
4
5
6
7
8
9
10
11
12
13
14
15
16
17
18
19
20
21
22
23
24
25
26
27
28
29
30
31
32
33
34
35
36
37
38
39
40
41
42
43
44
45
46
47
48
49
50
51
52
53
54
55
56
57
58
59
60
61
62
63
| [iyunv@nginx ~]# wget --no-check-certificate http://awstats.sourceforge.net/files/awstats-7.0.tar.gz
[iyunv@nginx ~]# tar xf awstats-7.0.tar.gz
[iyunv@nginx ~]# mkdir /var/lib/awstats
[iyunv@nginx logs]# mkdir /usr/local/awstats
[iyunv@nginx ~]# mv awstats-7.0/* /usr/local/awstats/
[iyunv@nginx ~]# cd /usr/local/awstats/tools/
[iyunv@nginx tools]# ./awstats_configure.pl
----- AWStats awstats_configure 1.0 (build 1.9) (c) Laurent Destailleur -----
This tool will help you to configure AWStats to analyze statistics for
one web server. You can try to use it to let it do all that is possible
in AWStats setup, however following the step by step manual setup
documentation (docs/index.html) is often a better idea. Above all if:
- You are not an administrator user,
- You want to analyze downloaded log files without web server,
- You want to analyze mail or ftp log files instead of web log files,
- You need to analyze load balanced servers log files,
- You want to 'understand' all possible ways to use AWStats...
Read the AWStats documentation (docs/index.html).
-----> Running OS detected: Linux, BSD or Unix
-----> Check for web server install
Enter full config file path of your Web server.
Example: /etc/httpd/httpd.conf
Example: /usr/local/apache2/conf/httpd.conf
Example: c:\Program files\apache group\apache\conf\httpd.conf
Config file path ('none' to skip web server setup):
> none #创建个新的站点
Your web server config file(s) could not be found.
You will need to setup your web server manually to declare AWStats
script as a CGI, if you want to build reports dynamically.
See AWStats setup documentation (file docs/index.html)
-----> Update model config file '/usr/local/awstats/wwwroot/cgi-bin/awstats.model.conf'
File awstats.model.conf updated.
-----> Need to create a new config file ?
Do you want me to build a new AWStats config/profile
file (required if first install) [y/N] ? y #首次配置
-----> Define config file name to create
What is the name of your web site or profile analysis ?
Example: www.mysite.com
Example: demo
Your web site, virtual server or profile name:
> #站点名称
-----> Define config file path
In which directory do you plan to store your config file(s) ?
Default: /etc/awstats
Directory path to store config file(s) (Enter for default):
>
-----> Create config file '/etc/awstats/awstats.www.renzhiyuan.com.conf'
Config file /etc/awstats/awstats.www.renzhiyuan.com.conf created.
-----> Add update process inside a scheduler
Sorry, configure.pl does not support automatic add to cron yet.
You can do it manually by adding the following command to your cron:
/usr/local/awstats/wwwroot/cgi-bin/awstats.pl -update -config=www.renzhiyuan.com
Or if you have several config files and prefer having only one command:
/usr/local/awstats/tools/awstats_updateall.pl now
Press ENTER to continue...
A SIMPLE config file has been created: /etc/awstats/awstats.www.renzhiyuan.com.conf
You should have a look inside to check and change manually main parameters.
You can then manually update your statistics for 'www.renzhiyuan.com' with command:
> perl awstats.pl -update -config=www.renzhiyuan.com
You can also build static report pages for 'www.renzhiyuan.com' with command:
> perl awstats.pl -output=pagetype -config=www.renzhiyuan.com
Press ENTER to finish...
[iyunv@nginx tools]#
|
2.3.2)配置awstats.www.renzhiyuan.com.conf
程序执行结束后,会在/etc/awstats/目录下生成你的配置文件。然后编辑配置文件,修改LogFile参数,跟日志切割脚本中的日志路径对应起来:
1
2
| LogFile="/usr/local/nginx/logs/access_%YYYY-24%MM-24%DD-24.log"
#LogFile="/usr/local/nginx/logs/access.log"
|
注意:根据自己日志切割方式,决定是监控昨天的还是先监控,然后再切割。
2.3.3)分析日志
1
2
3
4
5
6
7
8
9
10
11
12
13
14
| [iyunv@nginx ~]# /usr/local/awstats/wwwroot/cgi-bin/awstats.pl --config=www.renzhiyuan.com
Create/Update database for config "/etc/awstats/awstats.www.renzhiyuan.com.conf" by AWStats version 7.0 (build 1.971)
From data in log file "/usr/local/nginx/logs/access.log"...
Phase 1 : First bypass old records, searching new record...
Searching new records from beginning of log file...
Jumped lines in file: 0
Parsed lines in file: 25
Found 0 dropped records,
Found 0 comments,
Found 0 blank records,
Found 25 corrupted records,
Found 0 old records,
Found 0 new qualified records.
[iyunv@nginx ~]#
|
2.4)配置awstats生产静态页面
1
| /usr/local/awstats/tools/awstats_buildstaticpages.pl -update -config=www.renzhiyuan.com -lang=cn -dir=/usr/local/nginx/html/awstats -awstatsprog=/usr/local/awstats/wwwroot/cgi-bin/awstats.pl
|
注意:-config=后面的参数是你在执行awstats_configure.pl时输入的站点域名。
2.4.1)计划任务
1
2
3
| [iyunv@nginx ~]# crontab -l
59 23 * * * /root/nginxcut.sh
1 0 * * * /usr/local/awstats/tools/awstats_buildstaticpages.pl -update -config=www.renzhiyuan.com -lang=cn -dir=/usr/local/nginx/html/awstats -awstatsprog=/usr/local/awstats/wwwroot/cgi-bin/awstats.pl
|
/usr/local/awstats/tools/awstats_buildstaticpages.pl Awstats 静态页面生成工具
-update -config=akii.org 更新配置项
-lang=cn 语言为中文
-dir= 统计结果输出目录
-awstatsprog=/usr/local/awstats/wwwroot/cgi-bin/awstats.pl Awstats 日志更新程序路径。
2.4.2)加密
1
2
3
4
5
6
7
8
| [iyunv@nginx ~]# yum install httpd-tools -y
[iyunv@nginx nginx]# pwd
/usr/local/nginx
[iyunv@nginx nginx]# htpasswd -cd renzhiyuan.pass renzhiyuan
New password:
Re-type new password:
Adding password for user renzhiyuan
[iyunv@nginx nginx]#
|
2.4.3)nginx配置文件配置
1
2
3
4
5
6
7
8
9
10
11
12
13
14
15
16
17
18
19
20
21
22
23
24
25
| [iyunv@nginx vhost]# cat awstats.conf
server {
listen 80;
server_name 192.168.1.220;
location ~ ^/awstats/ { # html 静态页面目录
root html;
index index.html;
access_log off;
error_log off;
charset gb2312;
# auth_basic "renzhiyuan";
# auth_basic_user_file /usr/local/nginx/.renzhiyuan.pass;
}
location ~ ^/icon/ { # 图标目录
root /usr/local/awstats/wwwroot;
index index.html;
access_log off;
error_log off;
}
location / {
return 403;
}
}
[iyunv@nginx vhost]#
|
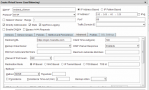
2.5)访问:

2.6)功能评估:
2.6.1)功能强大,但是要注意awstats的安全,比如漏洞,平时做好安全工作。
方式三、用ELK统计Nginx日志:
3.1)搭建ELK日志系统:(可参考之前文章)
3.2)logstash分析Nginx日志
1
2
3
4
5
6
7
8
9
10
11
12
13
14
15
16
17
18
19
20
21
22
23
24
25
| [iyunv@elk config]# cat catalinalog.conf
input {
file {
path => "/usr/local/nginx/log/access.log" #日志路径
start_position => "beginning"
}
}
filter {
if [path] =~ "access" {
mutate { replace => { "type" => "nginx access.log" } }
grok {
match => { "message" => "%{COMBINEDAPACHELOG}" }
}
}
date {
match => [ "timestamp" , "dd/MMM/yyyy:HH:mm:ss Z" ]
}
}
output {
elasticsearch {
hosts => ["192.168.1.225:9200"] #elasticsearch地址
}
stdout { codec => rubydebug }
}
[iyunv@elk config]#
|
3.3)访问效果:

3.4)安装可视化工具(后期详细讲解)
3.5)功能评估
3.5.1)功能特别强大,但是技术要求高。
|
|
 QQ群⑧:
QQ群⑧:


 窥视卡
窥视卡 雷达卡
雷达卡 发表于 2017-2-23 09:00:26
 提升卡
提升卡 置顶卡
置顶卡 沉默卡
沉默卡 喧嚣卡
喧嚣卡 变色卡
变色卡 千斤顶
千斤顶 显身卡
显身卡